Know which electrodes to trust
Noise per electrode in µV, active and silent electrodes, high-noise channels flagged, amplitude map across the array.
Send us recordings from organoids or iPSC-derived neurons. Within five working days you get quality control, bursts, network bursts, synchrony and connectivity, with figures, data tables, a methods paragraph and the code behind every number.
Noise per electrode in µV, active and silent electrodes, high-noise channels flagged, amplitude map across the array.
Firing rate, interspike intervals, coefficient of variation and single-electrode bursts by maximum interval.
Rate per minute, duration, spikes and participation per burst, regularity, and a map of where each burst starts.
Spike time tiling coefficient for every electrode pair, tested against jittered surrogates, plus a functional network with modules.
Written for a manuscript, with the parameter values of your run filled in, and the references to cite.
CSV tables, PNG figures, the exact command, software versions and a checksum of each input file.
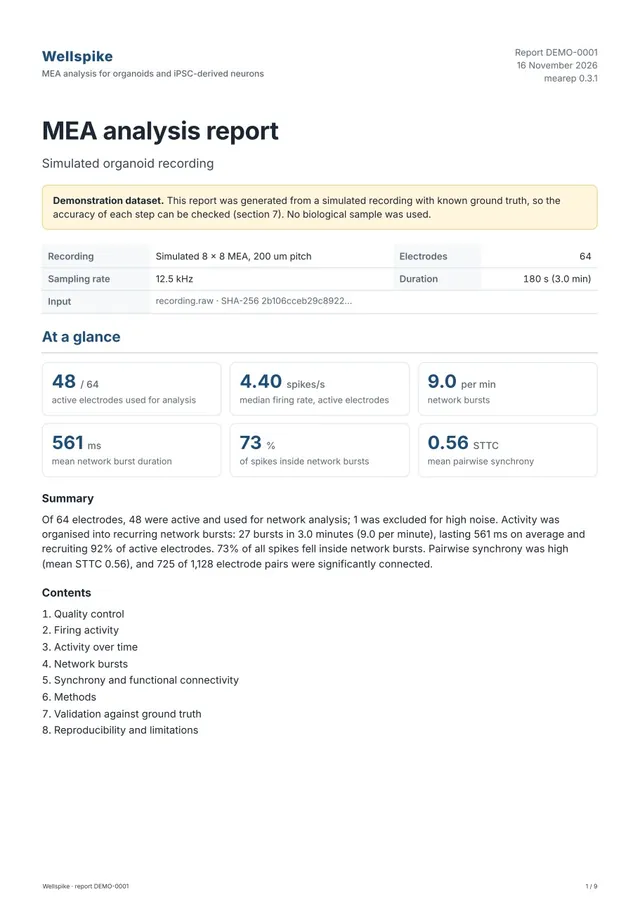
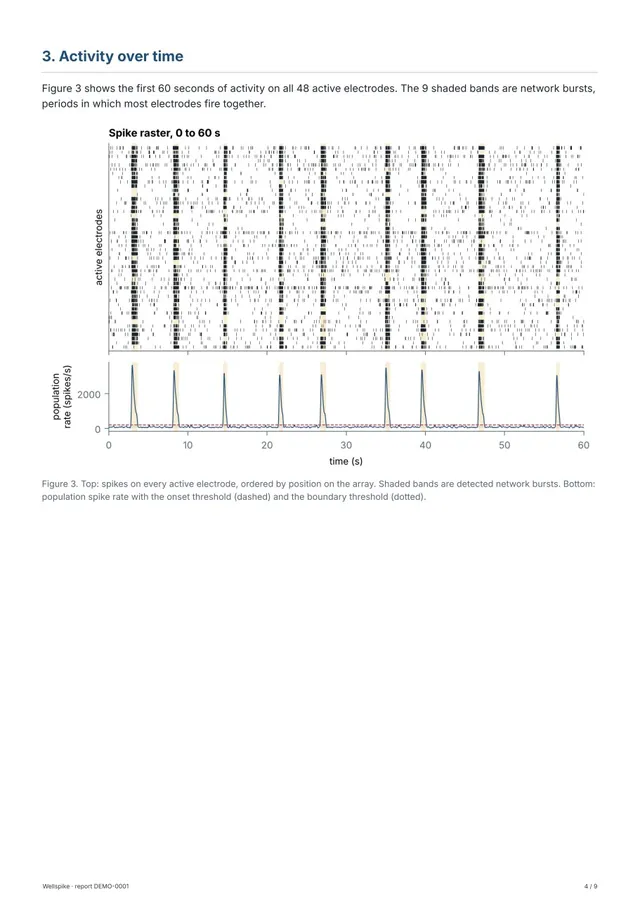
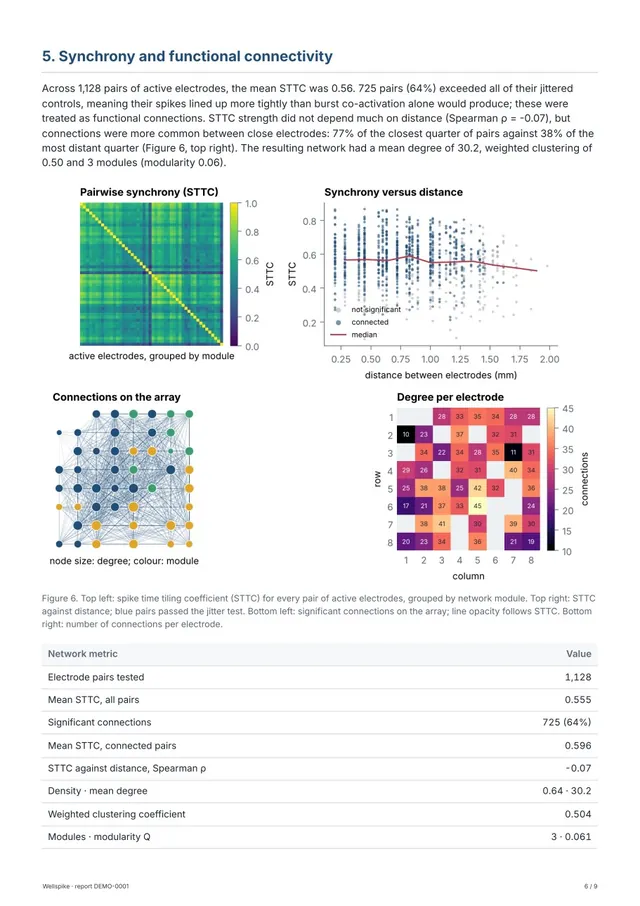
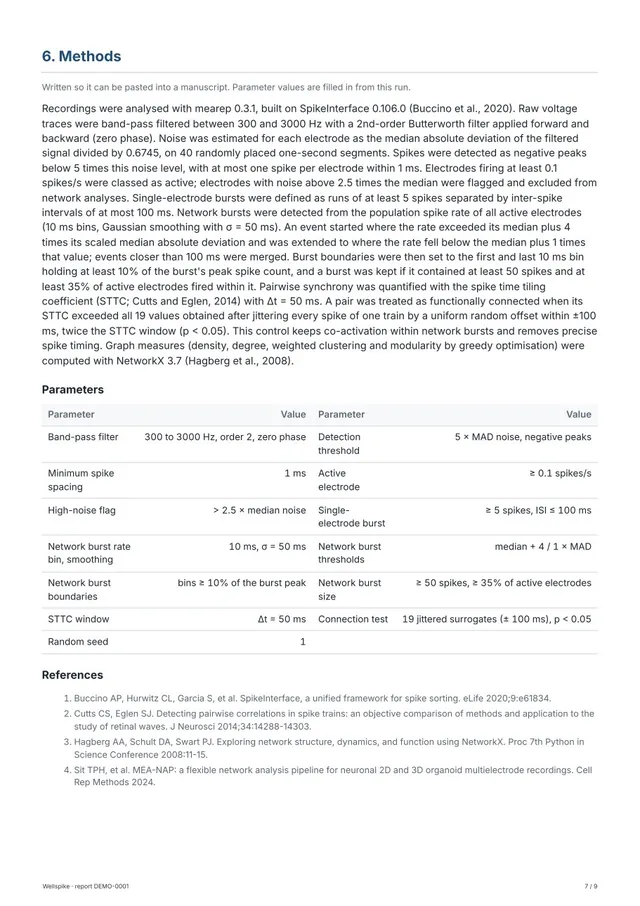
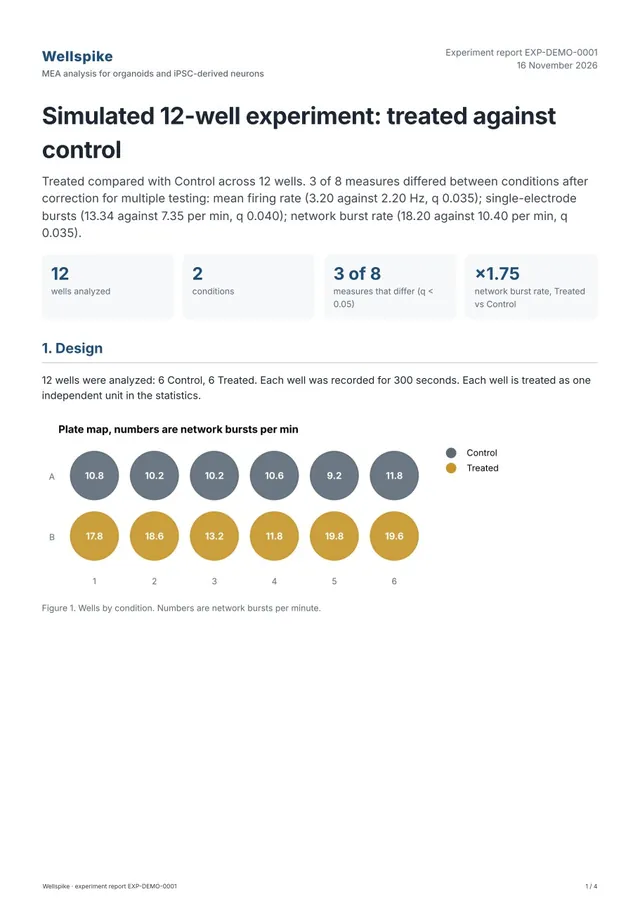
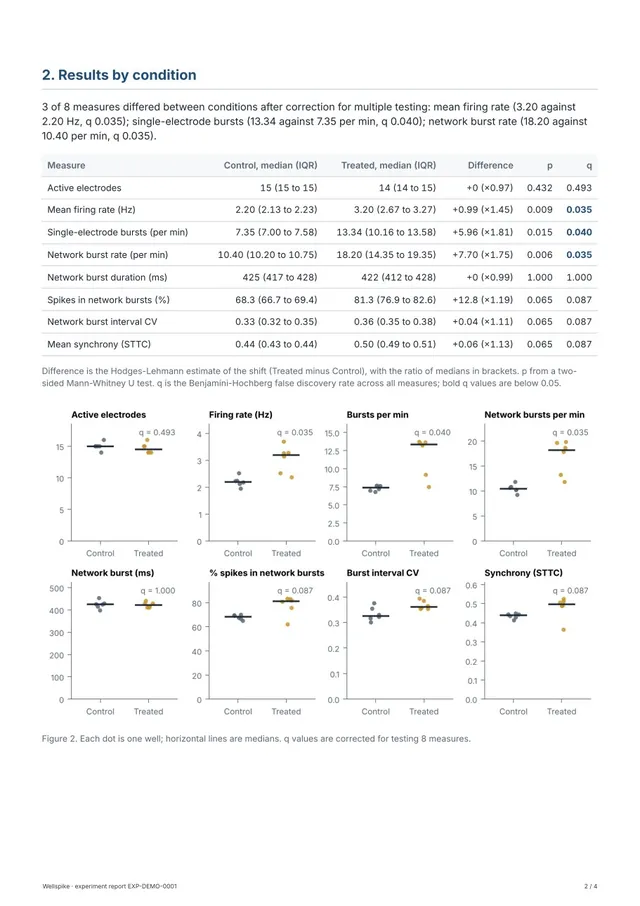
Both samples come from simulated data: one 8 × 8 recording, and a 12-well plate where treated wells were set to burst more often. That is why they can show checks against known answers. Download the full PDFs: one recording, 9 pages and one experiment, 4 pages.
Before analyzing real data, we ran the pipeline on a simulated recording in which every spike and every network burst is known: 64 electrodes, 180 seconds, 12.5 kHz, one deliberately noisy electrode.
Small spikes are the weak point. Spikes under five times the noise level were found only 20% of the time, so every report lists the detection threshold and noise for each electrode. A test on simulated data shows the method works as designed. It does not replace a check on your own recordings, which is what the free file check is for.
Not sure your files will work? Send one. We check that it opens and tell you what the report will cover, free of charge.
| System | Files | What we use |
|---|---|---|
| MaxWell MaxOne, MaxTwo | .raw.h5 | Raw recording |
| Multi Channel Systems | .h5, .raw | Raw recording |
| 3Brain BioCAM | .brw | Raw recording |
| Axion Maestro | spike list .csv | Spike times and amplitudes exported from AxIS Navigator |
| Intan | .rhd, .rhs | Raw recording |
| NWB, Open Ephys | .nwb, session folder | Raw recording |
We check that it opens and reply with what the report will cover.
One price for the whole experiment, agreed before any work starts.
We send an upload link and confirm when every file opens.
PDF, tables, figures and code within five working days.
Corrections within the agreed scope are free for 30 days after delivery.
EUR 790 for companies. One experiment, up to 12 recordings of up to 30 minutes each. A single recording: EUR 170, or EUR 290 for companies.
Priced from the number of recordings and comparisons. Statistics across wells, organoids or conditions included when you share the design.
For labs that record every week: a fixed number of reports per month, with the same settings every time.
We do not share your data. Files are deleted 30 days after delivery unless you ask us in writing to keep them. You keep all rights to the data and the results.
The analysis is for research. It is not validated for clinical decisions or regulatory submissions.
Wellspike was started in 2026 by Siyao Gui, who holds an MSc from the Technical University of Denmark with a background in computer science and data science.
The analysis is run by an AI agent (Claude, by Anthropic) on a fixed, tested pipeline built on the open-source SpikeInterface library. Every report is checked against a written checklist and approved by the founder before it is sent.
Not in the standard report. It reports activity per electrode, which is what most MEA papers on organoids and iPSC-derived neurons use. Ask if you need spike sorting for high-density arrays.
Yes. Send your current settings or results and we will either reproduce them or explain where and why the numbers differ.
Yes. Give us a plate map or a list of which well or organoid belongs to which condition. Each one counts as a unit, conditions are compared with rank-based tests corrected for multiple testing, and every well is shown, as in the sample experiment report.
Send one file anyway. If the open-source readers we use can open it, we can analyze it. If not, we tell you which export to use instead.
Tell us within 30 days. We check it against your files, correct it free of charge and send a new version within 3 working days, with the change listed. Before any report reaches you, an automated check cross-checks every number in it against the data tables, and a person approves it.
An AI agent runs the pipeline, drafts the report text from the numbers and prepares emails. The pipeline itself is ordinary, versioned code with fixed parameters, and a person approves every report before delivery.
We reply with what the report will cover and a fixed price. Attach one file, or a link to it, and we check it for free.
hello@wellspike.comOpen in your email app